Simulation study: do the weights recover known effects?
Source:vignettes/articles/simulations.Rmd
simulations.RmdThis article checks, by simulation, whether the new features of ipw do what they should: each scenario generates data in which the true causal effect is known, estimates it, and repeats this hundreds of times, in the spirit of the simulated example in the JSS paper (van der Wal & Geskus 2011).
Main findings
- The new weights remove confounding when their model is correct. Naive analyses and weights from misspecified models are biased by 15% to over 200%; the new weights reduce this to 0 to 5%.
- The remaining small biases (3 to 5%) are properties of inverse probability weighting, not of the implementation. Weights computed from the true model (oracle weights) have the same bias for log-normal doses, and for smooth terms and ordinal exposures the bias shrinks as the sample grows.
-
ipwboot()gives accurate standard errors when the weights are well behaved, where robust standard errors are 8 to 10% too large. It does not fix analyses with extreme weights: with poor overlap or long products of time-varying weights, no standard error reaches 95% coverage, and the bootstrap is then not better than the robust standard error.
How the results were produced. The study is in dev/simulation-study.R;
the code below shows the essential lines of each scenario. It takes
about 20 minutes on 4 cores, so this page shows saved results. To
reproduce them, run Rscript dev/simulation-study.R in the
package folder (seed 20261101, L’Ecuyer random numbers, 4 parallel
workers), or start the simulations workflow from the GitHub
Actions tab. Replications: 500 for scenarios 1 to 4, 250 for 5 and 6,
200 for the large-sample and oracle checks, 1000 for 7a and 7b, and 500
for 7c and 7d, each with 200 bootstrap samples.
Reading the tables. Bias is the mean estimate minus the truth. The MCSE (Monte Carlo standard error) shows how precisely the simulation estimates that bias: a bias within about 2 MCSE of 0 could be simulation noise. Empirical SD is the spread of the estimates; RMSE combines bias and spread.
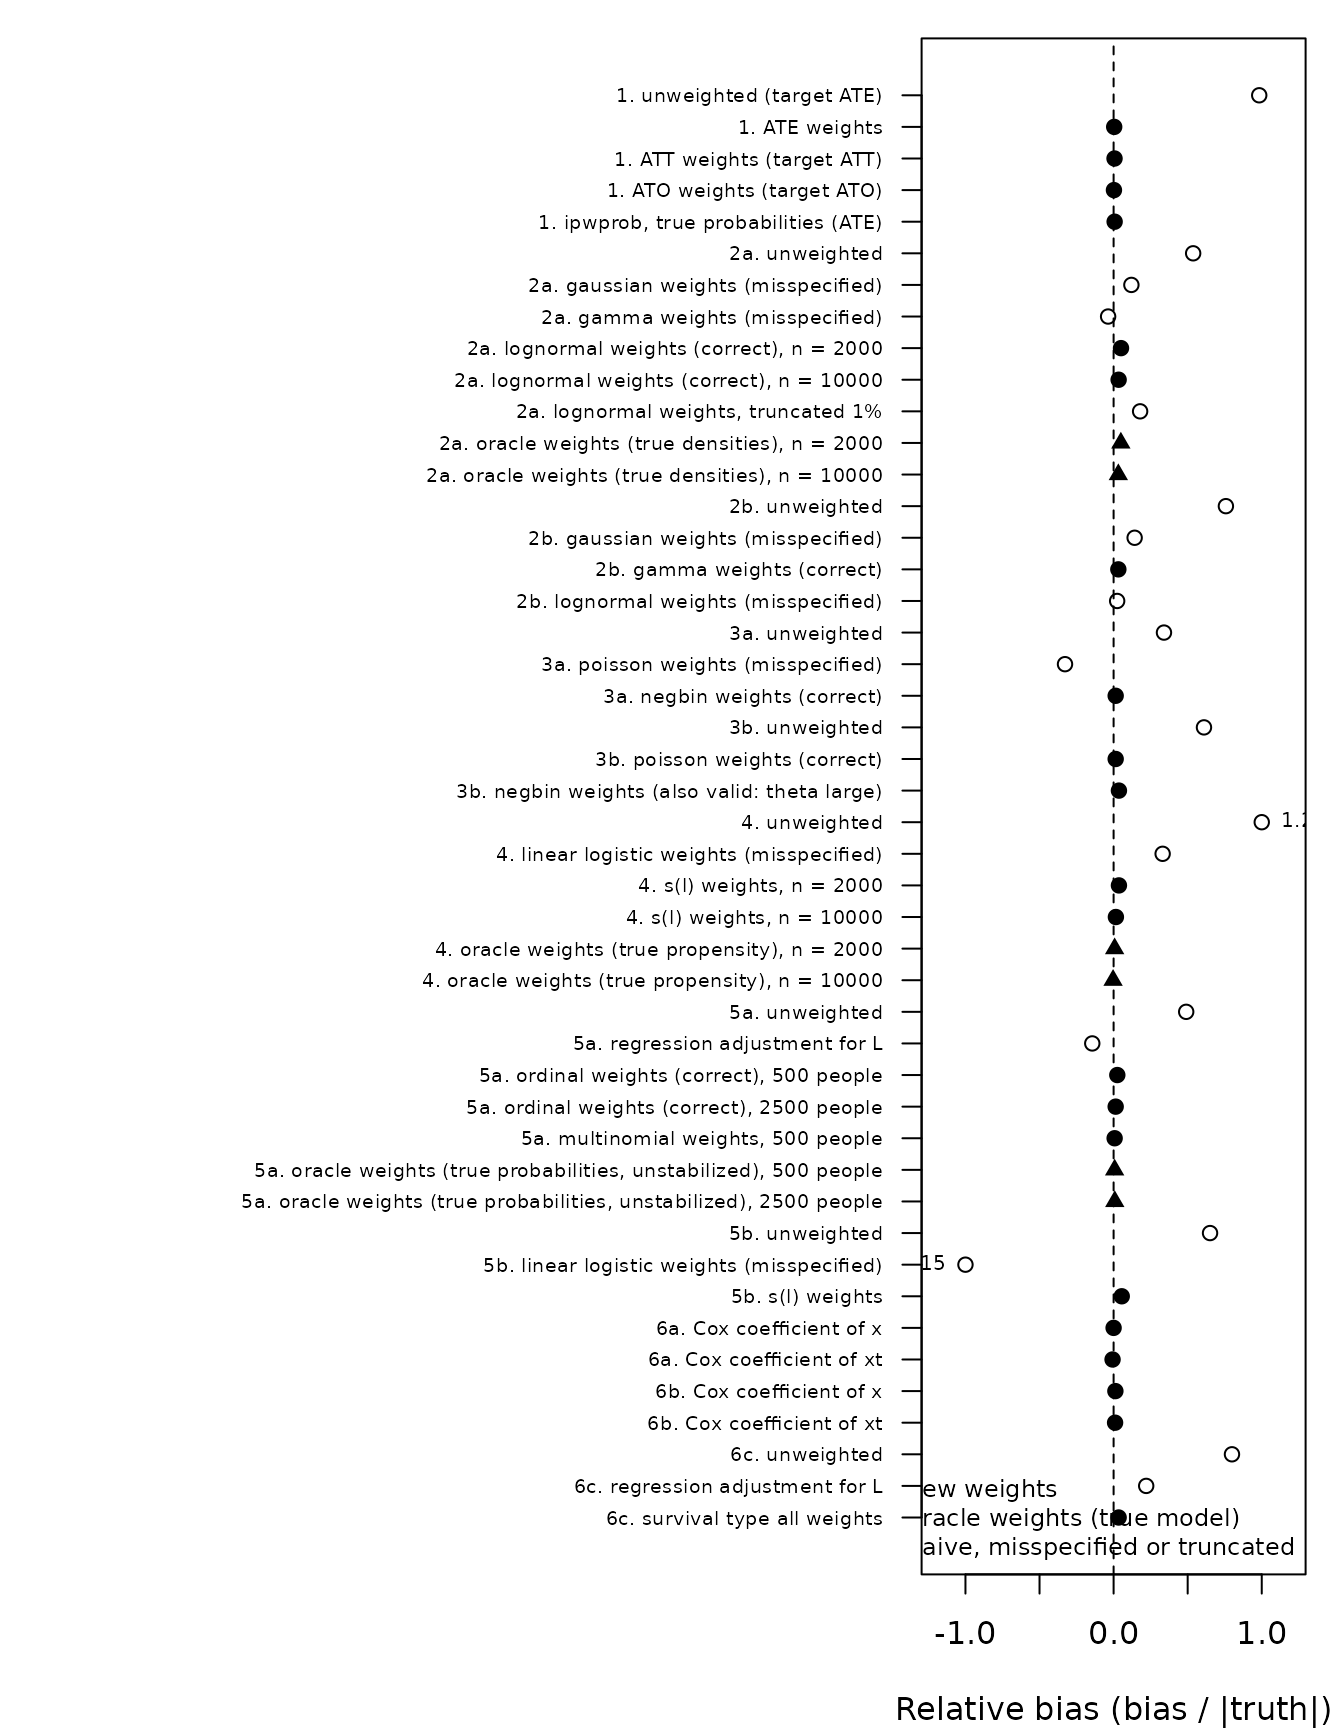
1. ATE, ATT and overlap weights, and ipwprob()
The effect of a binary exposure varies with the confounder
l, so the three estimands differ. Their true values, from 2
million simulated people, are ATE = 1.00, ATT = 1.27 and ATO = 0.86.
Each weighting scheme is compared with its own target;
ipwprob() is given the true propensity scores.
d <- data.frame(l = rnorm(1000))
d$a <- rbinom(1000, 1, plogis(0.5 + 0.8 * d$l))
d$y <- d$a * (1 + d$l) + d$l + rnorm(1000)
w.att <- ipwpoint(exposure = a, family = "binomial", link = "logit",
                  denominator = ~ l, data = d, estimand = "ATT")$ipw.weights
coef(lm(y ~ a, data = d, weights = w.att))["a"]| Method | Truth | Mean estimate | Bias | MCSE of bias | Empirical SD | RMSE | Replications |
|---|---|---|---|---|---|---|---|
| unweighted (target ATE) | 0.999 | 1.981 | 0.982 | 0.005 | 0.112 | 0.988 | 500 |
| ATE weights | 0.999 | 1.003 | 0.004 | 0.004 | 0.080 | 0.080 | 500 |
| ATT weights (target ATT) | 1.275 | 1.283 | 0.008 | 0.004 | 0.099 | 0.099 | 500 |
| ATO weights (target ATO) | 0.861 | 0.863 | 0.002 | 0.003 | 0.078 | 0.078 | 500 |
| ipwprob, true probabilities (ATE) | 0.999 | 1.006 | 0.007 | 0.006 | 0.139 | 0.139 | 500 |
All weighted estimates are within 1% of their own estimand; the unweighted difference is twice the ATE.
2. Skewed continuous exposures: gaussian, gamma or log-normal
One unit of dose raises the outcome by 1. In 2a the dose is
log-normal given l, in 2b gamma. In 2a the true densities
are known, so oracle weights (the true marginal density over
the true conditional density) show what weighting can achieve without
any estimation error; they are also computed for a 5 times larger
sample.
d <- data.frame(l = rnorm(2000))
d$dose <- exp(0.5 + 0.5 * d$l + rnorm(2000, 0, 0.6))   # 2b: rgamma(2000, 3, 3 / exp(0.5 + 0.3 * d$l))
d$y <- d$dose + 2 * d$l + rnorm(2000)
w.ln <- ipwpoint(exposure = dose, family = "lognormal", numerator = ~ 1,
                 denominator = ~ l, data = d)$ipw.weights
oracle <- dlnorm(d$dose, 0.5, sqrt(0.61)) / dlnorm(d$dose, 0.5 + 0.5 * d$l, 0.6)| Method | Truth | Mean estimate | Bias | MCSE of bias | Empirical SD | RMSE | Replications |
|---|---|---|---|---|---|---|---|
| unweighted | 1 | 1.537 | 0.537 | 0.002 | 0.041 | 0.538 | 500 |
| gaussian weights (misspecified) | 1 | 1.120 | 0.120 | 0.015 | 0.344 | 0.363 | 493 |
| gamma weights (misspecified) | 1 | 0.963 | -0.037 | 0.008 | 0.177 | 0.181 | 500 |
| lognormal weights (correct), n = 2000 | 1 | 1.050 | 0.050 | 0.004 | 0.096 | 0.108 | 500 |
| lognormal weights (correct), n = 10000 | 1 | 1.034 | 0.034 | 0.005 | 0.065 | 0.073 | 200 |
| lognormal weights, truncated 1% | 1 | 1.179 | 0.179 | 0.002 | 0.038 | 0.183 | 500 |
| oracle weights (true densities), n = 2000 | 1 | 1.049 | 0.049 | 0.005 | 0.104 | 0.115 | 500 |
| oracle weights (true densities), n = 10000 | 1 | 1.032 | 0.032 | 0.005 | 0.067 | 0.074 | 200 |
| Method | Truth | Mean estimate | Bias | MCSE of bias | Empirical SD | RMSE | Replications |
|---|---|---|---|---|---|---|---|
| unweighted | 1 | 1.758 | 0.758 | 0.002 | 0.040 | 0.759 | 500 |
| gaussian weights (misspecified) | 1 | 1.142 | 0.142 | 0.004 | 0.079 | 0.162 | 500 |
| gamma weights (correct) | 1 | 1.032 | 0.032 | 0.005 | 0.111 | 0.115 | 500 |
| lognormal weights (misspecified) | 1 | 1.024 | 0.024 | 0.010 | 0.220 | 0.221 | 500 |
The correct family removes most of the confounding (unweighted bias
54% and 76%). The 3 to 5% that remains is the same for oracle
weights (5.0% vs 4.9% at n = 2000, 3.4% vs 3.2% at n = 10000),
so it does not come from estimating the model: it is the finite-sample
bias of weighting with densities of a skewed exposure, whose density
ratios have a heavy tail, and it shrinks slowly as the sample grows. The
gaussian model is clearly worse, and in 7 of 500 replications gave
infinite weights, which ipwpoint() refuses. A misspecified
skewed family (gamma for log-normal data or the reverse) has a small
bias but up to twice the spread. Truncation reduces the spread a lot but
adds bias.
3. Count exposures: Poisson or negative binomial
Each extra unit of a count exposure raises the outcome by 0.5. In 3a the counts are overdispersed (negative binomial); in 3b they are Poisson.
d <- data.frame(l = rnorm(1000))
d$v <- rnbinom(1000, size = 2, mu = exp(0.5 + 0.4 * d$l))   # 3b: rpois(1000, exp(0.5 + 0.4 * d$l))
d$y <- 0.5 * d$v + d$l + rnorm(1000)
w.nb <- ipwpoint(exposure = v, family = "negbin", numerator = ~ 1,
denominator = ~ l, data = d)$ipw.weights| Method | Truth | Mean estimate | Bias | MCSE of bias | Empirical SD | RMSE | Replications |
|---|---|---|---|---|---|---|---|
| unweighted | 0.5 | 0.670 | 0.170 | 0.001 | 0.022 | 0.171 | 500 |
| poisson weights (misspecified) | 0.5 | 0.336 | -0.164 | 0.003 | 0.068 | 0.178 | 500 |
| negbin weights (correct) | 0.5 | 0.507 | 0.007 | 0.002 | 0.035 | 0.035 | 500 |
| unweighted | 0.5 | 0.805 | 0.305 | 0.001 | 0.028 | 0.307 | 500 |
| poisson weights (correct) | 0.5 | 0.507 | 0.007 | 0.003 | 0.062 | 0.063 | 500 |
| negbin weights (also valid: theta large) | 0.5 | 0.518 | 0.018 | 0.003 | 0.064 | 0.066 | 500 |
With the correct model, both families are within 1.5% of the truth. The Poisson model applied to overdispersed counts over-corrects as strongly as the unweighted analysis under-corrects. The negative binomial model remains usable for Poisson data (bias 3.6%), so it is the safer choice when in doubt.
4. Curved propensity: smooth terms with mgcv
The probability of exposure depends on l through a sine
curve; the true effect is 2. Oracle weights use the true propensity.
d <- data.frame(l = runif(2000, -2, 2))
d$a <- rbinom(2000, 1, plogis(2 * sin(1.5 * d$l)))
d$y <- 2 * d$a + 3 * sin(1.5 * d$l) + rnorm(2000)
w.gam <- ipwpoint(exposure = a, family = "binomial", link = "logit",
numerator = ~ 1, denominator = ~ s(l), data = d)$ipw.weights| Method | Truth | Mean estimate | Bias | MCSE of bias | Empirical SD | RMSE | Replications |
|---|---|---|---|---|---|---|---|
| unweighted | 2 | 4.553 | 2.553 | 0.004 | 0.090 | 2.554 | 500 |
| linear logistic weights (misspecified) | 2 | 2.662 | 0.662 | 0.004 | 0.079 | 0.667 | 500 |
| s(l) weights, n = 2000 | 2 | 2.072 | 0.072 | 0.003 | 0.062 | 0.095 | 500 |
| s(l) weights, n = 10000 | 2 | 2.031 | 0.031 | 0.002 | 0.026 | 0.040 | 200 |
| oracle weights (true propensity), n = 2000 | 2 | 2.014 | 0.014 | 0.007 | 0.148 | 0.149 | 500 |
| oracle weights (true propensity), n = 10000 | 2 | 1.993 | -0.007 | 0.005 | 0.065 | 0.066 | 200 |
A straight-line logistic model leaves a quarter of the confounding
bias. With s(l) the bias is 3.6% at n = 2000 and 1.5% at n
= 10000: it halves as the sample grows five-fold, as expected for a
smoothing estimate that approaches the true curve. Oracle weights are
unbiased, which confirms that the remaining bias comes from estimating
the curve.
5. Time-varying exposure, type = "all"
5a. Ordinal dose
A dose level (0, 1, 2) is chosen at each of 4 visits from a
proportional-odds model given the confounder L and the
previous dose. L is affected by the previous dose and by an
unmeasured U that also affects the outcome; the outcome
rises by 1 per unit of cumulative dose. This is the situation in the JSS
paper where ordinary adjustment fails.
for (t in 1:4) {
  l <- U + 0.4 * prev + rnorm(n, 0, 0.5)
  dose <- findInterval(0.8 * l + 0.6 * prev + rlogis(n), c(0, 1.5))   # 0, 1, 2
  prev <- dose
}
y <- cumulative.dose + 2 * U + rnorm(n)
w <- ipwtm(exposure = dose, family = "ordinal", link = "logit",
           numerator = ~ dose.lag, denominator = ~ dose.lag + l,
           id = id, timevar = time, type = "all", data = long)
# weight at the last visit, then lm(y ~ cumulative.dose, weights = ...)| Method | Truth | Mean estimate | Bias | MCSE of bias | Empirical SD | RMSE | Replications |
|---|---|---|---|---|---|---|---|
| unweighted | 1 | 1.490 | 0.490 | 0.002 | 0.034 | 0.491 | 250 |
| regression adjustment for L | 1 | 0.856 | -0.144 | 0.002 | 0.029 | 0.147 | 250 |
| ordinal weights (correct), 500 people | 1 | 1.025 | 0.025 | 0.008 | 0.122 | 0.124 | 250 |
| ordinal weights (correct), 2500 people | 1 | 1.014 | 0.014 | 0.005 | 0.073 | 0.074 | 200 |
| multinomial weights, 500 people | 1 | 1.007 | 0.007 | 0.008 | 0.133 | 0.133 | 250 |
| oracle weights (true probabilities, unstabilized), 500 people | 1 | 1.007 | 0.007 | 0.010 | 0.152 | 0.152 | 250 |
| oracle weights (true probabilities, unstabilized), 2500 people | 1 | 1.008 | 0.008 | 0.006 | 0.083 | 0.084 | 200 |
Both naive analyses are biased (+49% and -14%). Ordinal and multinomial weights recover the effect; the 2.5% bias of the ordinal weights at 500 people falls to 1.4% at 2500, and oracle weights are within 1%.
5b. Smooth terms in ipwtm()
A binary exposure is chosen at each visit with a curved effect of
L (logit = -0.3 + 2 sin(1.5 L) + 0.6 × previous exposure),
in the same design.
w <- ipwtm(exposure = a, family = "binomial", link = "logit", numerator = ~ a.lag,
denominator = ~ a.lag + s(l), id = id, timevar = time, type = "all", data = long)| Method | Truth | Mean estimate | Bias | MCSE of bias | Empirical SD | RMSE | Replications |
|---|---|---|---|---|---|---|---|
| unweighted | 1 | 1.651 | 0.651 | 0.004 | 0.061 | 0.654 | 250 |
| linear logistic weights (misspecified) | 1 | -0.152 | -1.152 | 0.033 | 0.526 | 1.266 | 250 |
| s(l) weights | 1 | 1.055 | 0.055 | 0.015 | 0.243 | 0.249 | 250 |
Here a straight-line model is worse than no weighting at all: its
weights turn the effect of +1 into a negative estimate. With
s(l) the bias is 5.5%.
6. Recurrent exposure events, family = "survival",
type = "all"
6a and 6b. Weights against the true weights
Exposure events (for example new prescriptions) happen repeatedly
with a known proportional hazard: baseline 2 per unit time, log hazard
ratio 0.5 for a fixed covariate x and -1 for a time-varying
covariate xt. Because the true hazard is known, the true
weights are known too. In 6a all people share a grid of 10 intervals (as
in haartdat); in 6b the events happen in continuous time,
xt changes at different times for each person, and each
event ends an interval (start-stop data cut at events, as in Graffeo et
al. 2018).
w <- ipwtm(exposure = expo, family = "survival", denominator = ~ x + xt,
           id = id, tstart = tstart, timevar = fuptime, type = "all", data = d)
coef(w$den.mod)
median(abs(log(w$ipw.weights / true.weights)))| Method | Truth | Mean estimate | Bias | MCSE of bias | Empirical SD | RMSE | Replications |
|---|---|---|---|---|---|---|---|
| Cox coefficient of x | 0.5 | 0.500 | 0.000 | 0.006 | 0.088 | 0.088 | 250 |
| Cox coefficient of xt | -1.0 | -1.007 | -0.007 | 0.007 | 0.118 | 0.118 | 250 |
| median |log(estimated / true weight)| | 0.0 | 0.074 | 0.074 | 0.001 | 0.022 | 0.077 | 250 |
| Method | Truth | Mean estimate | Bias | MCSE of bias | Empirical SD | RMSE | Replications |
|---|---|---|---|---|---|---|---|
| Cox coefficient of x | 0.5 | 0.506 | 0.006 | 0.005 | 0.084 | 0.084 | 250 |
| Cox coefficient of xt | -1.0 | -0.990 | 0.010 | 0.007 | 0.104 | 0.104 | 250 |
| median |log(estimated / true weight)| | 0.0 | 0.090 | 0.090 | 0.001 | 0.022 | 0.092 | 250 |
The Cox coefficients are unbiased in both designs, and the estimated weights are typically within 7 to 9% of the true weights, which is the estimation noise of the baseline hazard.
6c. Causal effect of the number of exposure events
Exposure events happen in continuous time with hazard 1.5 exp(0.6 L).
L is updated at 4 visits, is lowered by earlier events (as
treatment raising CD4 lowers the need for more) and depends on an
unmeasured U that also affects the outcome. The outcome
rises by 1 per event.
w <- ipwtm(exposure = expo, family = "survival", numerator = ~ 1, denominator = ~ l,
           id = id, tstart = tstart, timevar = fuptime, type = "all", data = d)
# weight at each person's last row, then lm(y ~ number.of.events, weights = ...)| Method | Truth | Mean estimate | Bias | MCSE of bias | Empirical SD | RMSE | Replications |
|---|---|---|---|---|---|---|---|
| unweighted | 1 | 1.799 | 0.799 | 0.004 | 0.060 | 0.801 | 250 |
| regression adjustment for L | 1 | 1.220 | 0.220 | 0.003 | 0.047 | 0.224 | 250 |
| survival type all weights | 1 | 1.034 | 0.034 | 0.012 | 0.193 | 0.196 | 250 |
The weights reduce the bias from 80% (unweighted) and 22% (adjustment
for L) to 3.4%. The method of Graffeo et al. uses, for an
interval ending in an event, the probability of an event during that
interval; this simulation shows that the approximation works for
estimating a causal effect.
7. Standard errors: ipwboot(), robust and naive
Each table shows the mean estimated standard error divided by the actual spread of the estimates (1 is ideal) and the coverage of 95% confidence intervals.
7a and 7b. Linear MSM for a binary exposure
True effect 10, n = 500, stabilized weights. In 7a, exposure probabilities are mostly between 0.1 and 0.9 (good overlap); 7b is the simulated example of the JSS paper, where many people are almost certain to be exposed or unexposed.
msm.effect <- function(dd) {
  w <- ipwpoint(exposure = a, family = "binomial", link = "logit", numerator = ~ 1,
                denominator = ~ l, data = dd)$ipw.weights
  coef(lm(y ~ a, data = dd, weights = w))["a"]
}
ipwboot(d, msm.effect, R = 200)| Method | Mean estimate | Mean SE | Empirical SD | SE / empirical SD | Coverage of 95% CI | MCSE of coverage | Replications |
|---|---|---|---|---|---|---|---|
| ipwboot, percentile CI | 9.981 | 0.492 | 0.487 | 1.011 | 0.936 | 0.008 | 1000 |
| ipwboot SE, Wald CI | 9.981 | 0.492 | 0.487 | 1.011 | 0.947 | 0.007 | 1000 |
| robust SE (svyglm), Wald CI | 9.981 | 0.536 | 0.487 | 1.101 | 0.967 | 0.006 | 1000 |
| Method | Mean estimate | Mean SE | Empirical SD | SE / empirical SD | Coverage of 95% CI | MCSE of coverage | Replications |
|---|---|---|---|---|---|---|---|
| ipwboot, percentile CI | 11.019 | 1.110 | 1.787 | 0.621 | 0.560 | 0.016 | 1000 |
| ipwboot SE, Wald CI | 11.019 | 1.110 | 1.787 | 0.621 | 0.585 | 0.016 | 1000 |
| robust SE (svyglm), Wald CI | 11.019 | 1.113 | 1.787 | 0.623 | 0.591 | 0.016 | 1000 |
With good overlap the bootstrap standard error is accurate (ratio 1.01, Wald coverage 94.7%), while the robust standard error is 10% too large (coverage 96.7%), in line with Austin (2016); percentile intervals cover slightly less than 95%. In the JSS example the estimate itself is biased (11.0 instead of 10) and all standard errors are 38% too small, so coverage is below 60% whatever method is used.
7c. Weighted Cox MSM
Austin (2016) studied weighted Cox models. Here event times are exponential with hazard 0.1 exp(-0.7 a + 0.8 l), censored at 5; n = 1000. The true marginal log hazard ratio, -0.624, is computed from both potential outcomes of 200,000 people (it differs from -0.7 because hazard ratios are not collapsible).
| Method | Mean estimate | Mean SE | Empirical SD | SE / empirical SD | Coverage of 95% CI | MCSE of coverage | Replications |
|---|---|---|---|---|---|---|---|
| naive SE (coxph), Wald CI | -0.61 | 0.117 | 0.113 | 1.037 | 0.952 | 0.010 | 500 |
| robust SE (coxph), Wald CI | -0.61 | 0.122 | 0.113 | 1.078 | 0.960 | 0.009 | 500 |
| ipwboot SE, Wald CI | -0.61 | 0.110 | 0.113 | 0.974 | 0.936 | 0.011 | 500 |
| ipwboot, percentile CI | -0.61 | 0.110 | 0.113 | 0.974 | 0.934 | 0.011 | 500 |
All three standard errors are close to the truth here. The robust standard error is again too large (+8%); the naive one (+4%) and the bootstrap (-3%) are within simulation noise of 1. With stabilized weights and good overlap, the bootstrap therefore brings no clear gain over the naive standard error in this setting.
7d. Time-varying exposure, bootstrap by person
The design of scenario 5 with a binary exposure;
ipwboot(id = id) resamples people with all their
visits.
ipwboot(long, tv.effect, id = id, R = 200)| Method | Mean estimate | Mean SE | Empirical SD | SE / empirical SD | Coverage of 95% CI | MCSE of coverage | Replications |
|---|---|---|---|---|---|---|---|
| ipwboot (id), percentile CI | 1.033 | 0.146 | 0.222 | 0.658 | 0.778 | 0.019 | 500 |
| ipwboot (id) SE, Wald CI | 1.033 | 0.146 | 0.222 | 0.658 | 0.792 | 0.018 | 500 |
| robust SE (svyglm), Wald CI | 1.033 | 0.163 | 0.222 | 0.737 | 0.838 | 0.016 | 500 |
Neither method is adequate here: the bootstrap standard error is 34% too small and the robust one 26% too small, with coverage of 79% and 84%. The weights are products over 4 visits, so a few people get very large weights and the estimate has a heavy-tailed distribution that 500 people do not represent well, the same problem as in 7b. Truncation, a larger sample or a better-balanced design would be needed; the bootstrap does not repair it.
Conclusions
The simulations support the new models: with the correct model, each
of them removes nearly all confounding, and the small biases that remain
are either shared by weights from the true model or shrink with the
sample size. They support ipwboot() for analyses with
well-behaved weights, where it gives accurate standard errors and robust
standard errors are conservative. They also show its limit: when weights
are extreme (poor overlap, long products of time-varying weights), no
standard error is reliable, and the first step is to examine the weights
(summary(), ipwplot()) and consider overlap
weights, truncation or a different model.
References
- Austin PC (2016). Variance estimation when using inverse probability of treatment weighting (IPTW) with survival analysis. Statistics in Medicine 35, 5642-5655.
- Graffeo N, Latouche A, Geskus RB, Chevret S (2018). Modeling time-varying exposure using inverse probability of treatment weights. Biometrical Journal 60, 323-332.
- Li F, Morgan KL, Zaslavsky AM (2018). Balancing covariates via propensity score weighting. Journal of the American Statistical Association 113, 390-400.
- van der Wal WM, Geskus RB (2011). ipw: An R package for inverse probability weighting. Journal of Statistical Software 43(13), 1-23.